

A medical practice can have fully booked schedules and still struggle to cover payroll, software subscriptions, overdue supplier invoices, and unexpected equipment costs. Poor financial visibility allows small revenue leaks and inefficient spending to accumulate until cash flow becomes a serious operational problem.
Medical administrators need a working understanding of budgeting terminology, healthcare revenue cycles, staffing expenses, reimbursement, and financial performance indicators. This interactive guide explains essential budgeting concepts, provides realistic calculations, and shows how to build a practical medical office budget that supports financial stability, operational efficiency, and sustainable patient care.

1. Medical Office Budgeting Fundamentals: Essential Concepts Every Healthcare Administrator Should Understand
Medical office budgeting involves planning how much money a practice expects to earn, spend, collect, and retain during a defined financial period.
Administrators contribute to budgeting by tracking expenses, monitoring patient volumes, reviewing supplier costs, coordinating billing activities, and identifying operational processes that create avoidable financial losses.
These responsibilities connect healthcare workflow automation, patient scheduling integrations, medical supplies ordering, and cloud-based EHR operations.
The five financial questions every medical office budget should answer
1. How much revenue can the practice realistically generate?
Revenue forecasts should reflect completed visits, service mix, payer contracts, expected reimbursements, and collection performance. Appointment capacity alone provides an incomplete estimate.
2. Which expenses are essential for maintaining operations?
Staff compensation, facility costs, medical supplies, insurance, utilities, and necessary technology represent important financial obligations.
3. When will the money actually arrive?
Insurance reimbursements and patient payments may arrive weeks after services are performed. Payment timing affects the practice's ability to meet immediate obligations.
4. Which costs increase as patient volume grows?
Disposable medical supplies, certain outsourced services, and transaction-based technology charges can rise with activity. Administrators must understand how additional visits affect operating expenses.
5. Which financial indicators reveal developing problems?
Rising accounts receivable, increasing denial rates, recurring overtime, and unfavorable budget variances can signal issues requiring investigation.
Accurate patient registration workflows, medical team communication, healthcare automation tools, and administrative technology troubleshooting help maintain the operational information used in these forecasts.
Operating budgets, capital budgets, and cash-flow forecasts
Three financial planning tools serve different purposes.
Operating budget: Estimates recurring revenue and expenses associated with providing services and running the practice. Common categories include staffing, rent, supplies, maintenance, and recurring software fees.
Capital budget: Plans significant longer-term investments such as diagnostic equipment, facility renovations, and major technology infrastructure. Capital purchases may be recorded as assets and expensed over time through depreciation, depending on applicable accounting treatment.
Cash-flow forecast: Estimates when money will actually enter and leave the practice's accounts. It helps administrators anticipate periods when payment obligations exceed available cash.
For example, purchasing diagnostic equipment may affect the capital budget immediately, while depreciation and financing costs influence financial statements over subsequent periods.
This distinction matters when reviewing medical office maintenance procedures, medical software integration, medical supplies ordering, and administrative workflow automation.
Cash accounting versus accrual accounting
Cash accounting generally recognizes receipts when money is collected and expenses when paid.
Accrual accounting recognizes revenue when earned and expenses when incurred, subject to the applicable accounting policies.
Consider a practice performing $40,000 in services during March but receiving $25,000 of related payments that month.
The remaining payments may arrive later. Accordingly, service revenue, cash receipts, and accounts receivable must be analyzed separately.
Healthcare administrators should use financial reports consistently and coordinate accounting classifications with the responsible finance professionals.
Relevant supporting processes include medical documentation software, medical admin dashboard reporting, healthcare analytics, and data management procedures.
36 of 36 terms shown
| # | Budgeting Term | Definition or Calculation | Practical Example or Warning | Medical Admin Action |
|---|---|---|---|---|
| 1 | Operating Budget | Forecast of recurring revenue and operating expenses. | Payroll and rent exceed the approved monthly plan. | Review commitments, spending trends, and operational reports. |
| 2 | Capital Budget | Plan for major investments in equipment, facilities, and long-lived assets. | An unplanned imaging-equipment purchase affects available cash. | Submit cost, useful life, financing, and implementation details for approval. |
| 3 | Cash-Flow Forecast | Projection of expected cash receipts, payments, and ending balances. | Receivables appear healthy while payroll cash is insufficient. | Track payment timing separately from recorded revenue. |
| 4 | Fixed Cost | Expense that remains largely unchanged across a relevant range of activity. | Rent remains due despite reduced patient volume. | Identify contractual obligations and renewal dates. |
| 5 | Variable Cost | Expense that changes with units of service or patient volume. | Supply consumption increases as visits rise. | Calculate variable cost per encounter using service volume data. |
| 6 | Semi-Variable Cost | Expense combining a fixed base and a usage-dependent component. | A software contract charges a platform fee plus per-transaction fees. | Review both the base commitment and usage rates. |
| 7 | Direct Cost | Cost directly attributable to an identified service or activity under the practice's costing policy. | A procedure requires identifiable supplies. | Track expense by service category through supply records. |
| 8 | Indirect Cost | Shared expense allocated across activities using an established method. | Facility utilities support several departments. | Apply the approved allocation basis consistently. |
| 9 | Overhead Ratio | Defined practice operating expenses divided by the selected revenue measure, multiplied by 100. | Expense growth outpaces collections. | Confirm whether provider compensation is included before comparing practices. |
| 10 | Fully Loaded Labor Cost | Wages plus employer payroll costs, benefits, and other assigned employment expenses. | Budgeting only hourly wages understates staffing cost. | Coordinate with payroll and approved expense reporting. |
| 11 | Full-Time Equivalent (FTE) | Staffing workload represented relative to the organization's full-time hours standard. | Part-time schedules distort headcount comparisons. | Convert paid or budgeted hours consistently and distinguish worked hours from paid leave. |
| 12 | Provider Productivity | Defined output per provider or clinical FTE, measured through visits, RVUs, or other suitable units. | Appointment capacity and completed service volume diverge. | Use verified appointment and encounter data. |
| 13 | Visit Volume | Count of completed encounters under a consistent operational definition. | Cancelled visits appear in the forecast as completed services. | Separate scheduled, completed, cancelled, and no-show encounters. |
| 14 | No-Show Rate | No-show appointments divided by appointments meeting the defined denominator, multiplied by 100. | Expected revenue exceeds actual completed-visit revenue. | Analyze through reminder and scheduling workflows. |
| 15 | Payer Mix | Distribution of practice activity or revenue among insurance and self-pay categories. | Visit volume stays stable while reimbursement changes. | Analyze payer mix by visits and by allowed revenue separately. |
| 16 | Gross Charges | Amounts billed before contractual adjustments and other applicable reductions. | High billed charges are mistaken for expected cash receipts. | Compare charges with allowed amounts and collections. |
| 17 | Contractual Adjustment | Reduction reflecting differences between billed charges and applicable contracted reimbursement. | A report treats routine contract adjustments as avoidable collection losses. | Separate adjustments from denials using accurate financial classifications. |
| 18 | Allowed Amount | Amount recognized under an applicable payer contract or payment rule for a service. | Forecasting assumes the full billed charge will be paid. | Verify the applicable payer and service-specific assumptions. |
| 19 | Net Patient Service Revenue | Patient-service revenue after applicable contractual and other estimated revenue adjustments under the accounting policy. | Gross charges are used to overstate operating performance. | Reconcile financial reporting definitions with finance staff. |
| 20 | Net Collection Rate | Payments divided by collectible charges, commonly charges less contractual adjustments, multiplied by 100. | Collectible balances repeatedly remain unpaid. | Analyze payer, patient, and denial-related causes using revenue cycle data. |
| 21 | Gross Collection Rate | Collections divided by gross charges for a matched period or cohort, multiplied by 100. | The figure is compared with net collection rate as though both measure the same thing. | Label methodology and reporting periods explicitly. |
| 22 | Accounts Receivable (A/R) | Uncollected amounts owed for services already recorded under the applicable accounting method. | Outstanding patient and payer balances grow. | Review aging, ownership, and follow-up status. |
| 23 | Days in A/R | Receivables divided by a consistently defined average daily revenue or charge measure. | Collection times are increasing. | Calculate with a consistent numerator and denominator, then investigate delays. |
| 24 | A/R Aging | Grouping receivables into age bands such as 0–30, 31–60, 61–90, and over 90 days. | Older receivables grow faster than new billing. | Prioritize recoverable balances and unresolved follow-up queues. |
| 25 | Claim Denial Rate | Denied claims divided by the applicable submitted or adjudicated claim population, multiplied by 100. | Repeated rejections create uncompensated staff work. | Classify causes by eligibility, authorization, coding, and documentation. |
| 26 | Clean Claim Rate | Claims meeting defined completeness and validation criteria on initial submission. | Correctable errors create preventable delays. | Improve checks at registration and documentation stages. |
| 27 | Cost to Collect | Defined revenue-cycle collection expenses divided by collections, multiplied by 100. | Outsourcing fees increase without an improvement in collections. | Include appropriate staffing, vendors, and technology costs. |
| 28 | Revenue per Visit | Selected revenue measure divided by completed visits in the same period. | Visit counts increase but receipts per encounter decline. | Review payer mix, service mix, and documentation using verified encounter records. |
| 29 | Contribution Margin | Revenue per service less associated variable cost, or total revenue less total variable costs. | An additional service generates less contribution than anticipated. | Use to analyze capacity and incremental costs without ignoring fixed expenses. |
| 30 | Break-Even Volume | Fixed costs divided by contribution per unit when the model assumptions apply. | Patient volume cannot cover the cost structure. | Test realistic visit capacity and collections assumptions. |
| 31 | Operating Margin | Operating income divided by operating revenue, multiplied by 100. | Revenue growth masks a larger increase in expenses. | Review margins across comparable periods and reporting definitions. |
| 32 | Budget Variance | Difference between actual results and approved budget amounts. | Repeated overspending has no assigned explanation. | Separate volume, price, timing, and usage causes. |
| 33 | Rolling Forecast | Updated future projection incorporating new actual results and assumptions. | An old annual budget remains unchanged despite major payer or staffing changes. | Update near-term assumptions using current data. |
| 34 | Work RVU (wRVU) | Relative-value measure reflecting physician or practitioner work under the applicable schedule. | Visit counts are compared without accounting for service complexity. | Use an appropriate provider productivity model and current payment-year data. |
| 35 | Depreciation | Allocation of a capital asset's depreciable cost over its useful life under applicable accounting rules. | An equipment purchase is treated as a recurring monthly cash purchase. | Coordinate asset schedules and cash payments with finance personnel. |
| 36 | Cash Reserve and Runway | Available unrestricted cash relative to upcoming net outflows or operating needs. | The practice has strong reported revenue but insufficient liquidity for upcoming commitments. | Monitor the minimum cash balance and maintain an approved contingency plan. |
Illustrative U.S. medical-office budgeting reference. Financial definitions and accounting treatments should be aligned with your organization's approved policies. Examples do not represent industry benchmarks.
2. Medical Practice Revenue Forecasting: Turning Patient Visits, Payer Mix, and Collections Into a Realistic Budget
A reliable revenue forecast begins with the services a practice expects to complete and the payments it reasonably expects to earn.
Medical offices can overestimate revenue when they use total appointments, posted charges, or historical collections without accounting for cancellations, payer differences, authorization problems, and service mix.
Calculate expected completed patient visits
Suppose a hypothetical outpatient practice operates with the following monthly schedule:
3 providers.
18 available patient appointments per provider each day.
20 clinical days per month.
An expected 8% combined cancellation and no-show loss that is not recovered through backfilling.
The monthly appointment capacity is:
3 × 18 × 20 = 1,080 appointment slots.
Expected completed visits are:
1,080 × 92% = 993.6, or approximately 994 visits.
This forecast depends on realistic scheduling assumptions. If cancelled appointments can be filled through a waitlist, some lost capacity may be recovered.
Administrators should analyze appointment wait-time management, patient scheduling integrations, appointment reminder software, and scheduling conflict management when estimating achievable appointment volume.
Use payer mix to calculate expected reimbursement
Different payers may reimburse different amounts for comparable services. The mix of services also affects expected revenue.
Consider an illustrative forecast of 1,000 completed visits:
500 commercial insurance visits at an average expected allowed amount of $150.
300 Medicare visits at an average expected amount of $110.
150 Medicaid visits at an average expected amount of $85.
50 self-pay visits at an average expected collectible amount of $90.
The estimated service revenue is:
(500 × $150) + (300 × $110) + (150 × $85) + (50 × $90) = $125,250.
This calculation is a simplified planning example. The rates are hypothetical and may differ substantially from actual contracted, statutory, or collected amounts.
For a more accurate forecast, separate payer-specific reimbursement from patient-responsibility collections and adjust for historically supported service mixes.
Administrators can improve the underlying information through patient registration, medical documentation systems, healthcare analytics, and medical admin dashboard reporting.
Calculate net collection rate correctly
Net collection rate measures how effectively a medical practice collects the revenue considered collectible after applicable contractual adjustments.
A common formulation is:
Net collection rate = payments ÷ (gross charges − contractual adjustments) × 100.
Suppose the practice reports the following matched-cohort amounts:
Gross charges: $180,000.
Contractual adjustments: $50,000.
Collectible amount: $130,000.
Payments collected against the cohort: $124,800.
The net collection rate is:
$124,800 ÷ $130,000 × 100 = 96%.
The remaining $5,200 represents amounts not collected within the measurement definition. Additional analysis is needed to distinguish amounts still outstanding, ultimately uncollectible balances, and other adjustments.
Always use compatible periods or claim cohorts. Comparing this month's cash receipts against unrelated current-month charges can distort the result.
The same principle applies to medical data management, workflow automation reports, healthcare analytics dashboards, and medical software integrations.
Analyze revenue leakage before increasing appointment volume
When a practice needs additional revenue, management may consider extending working hours or scheduling more patients.
However, existing revenue can be lost through avoidable billing and administrative errors.
Common causes include incomplete eligibility verification, missing authorizations, incorrect demographic information, documentation gaps, and unresolved claim denials.
A practice with 1,000 completed visits and a $5,000 avoidable monthly collection shortfall should investigate the underlying issue before assuming that more patient appointments are necessary.
The investigation should establish:
Where the loss originates. Identify the specific patient registration, documentation, authorization, claim, or collection stage involved.
Whether the loss is recoverable. Separate collectible outstanding balances from contractual reductions and appropriately approved write-offs.
How often the failure occurs. Track issue frequency by payer, department, provider, and administrative process.
Whether the corrective action works. Compare validated results after implementing the improvement.
These checks benefit from medical transcription accuracy, virtual check-in procedures, administrative troubleshooting, and secure team communication.
Understand Medicare payment forecasting and work RVUs
For applicable services paid through the Medicare Physician Fee Schedule, payment calculations incorporate relative value units for professional work, practice expense, and malpractice expense, along with geographic adjustments and an applicable conversion factor.
As of November 2026, CMS has finalized its calendar year 2027 Physician Fee Schedule. Administrators planning 2027 budgets should use the applicable final-year rates and distinguish qualifying alternative payment model participants from other practitioners where relevant.
Forecasts should also account for service location, payer-specific contracts, and whether a service is reimbursed through a different payment system.
The work RVU represents one component of the Medicare relative value framework. It can help evaluate provider productivity when used with an appropriate methodology.
Understanding these distinctions supports medical office analytics, medical documentation accuracy, data management systems, and administrative performance reporting.
3. Medical Office Expense Management: Staffing, Supplies, Technology, and Overhead Control
A sustainable medical office budget identifies the expenses necessary to provide services and the factors that cause those expenses to increase.
Healthcare administrators should evaluate costs alongside patient volume, service requirements, employee workload, and operational quality.
A lower expense may produce a higher downstream cost when it creates repeated rework, additional claims corrections, or avoidable staffing problems.
Staffing costs: Calculate the true expense of an employee
Employee budgets should account for wages, employer payroll taxes, benefits, paid time off, and other applicable employment expenses.
Suppose a medical practice employs an administrative coordinator with an hourly wage of $22.
Assuming 40 paid hours per week and 52 paid weeks annually:
$22 × 40 × 52 = $45,760 in annual base wages.
If the practice estimates additional employer costs at 25% of base wages:
$45,760 × 1.25 = $57,200 in estimated annual loaded employment cost.
The average monthly loaded cost is approximately $4,766.67.
The 25% additional-cost assumption is illustrative. Actual employer costs must reflect the practice's compensation arrangements, benefits, payroll requirements, and accounting policies.
Administrators should also distinguish headcount from full-time equivalents.
Two employees working 20 hours each per week represent one FTE when the organization's full-time standard is 40 hours.
These calculations matter when allocating staff to medical front-desk operations, appointment scheduling, patient communication workflows, and administrative documentation.
Labor productivity: Identify staffing shortages and inefficient allocation
Suppose a registration team processes 1,600 patient check-ins per month using 320 productive staff hours.
The team completes an average of:
1,600 ÷ 320 = 5 check-ins per productive hour.
Now imagine that a revised registration process requires employees to enter the same information into two disconnected applications.
If the duplicate-entry step adds three minutes per registration, the added workload is:
1,600 × 3 minutes = 4,800 minutes, or 80 staff hours monthly.
At a loaded labor cost of $30 per hour, the additional work represents $2,400 per month.
Improving the underlying patient registration process, medical software integration, workflow automation, and healthcare data management could reduce this avoidable workload.
Productivity measures should also account for task complexity, patient needs, accuracy, and the responsibilities assigned to employees.
Medical supply budgeting: Calculate the reorder point
Supply costs can rise because of overordering, product waste, poor inventory visibility, rush shipping, or inconsistent purchasing procedures.
A reorder point helps determine when replenishment should begin.
A simplified formula is:
Reorder point = average daily usage × supplier lead time + safety stock.
Suppose a clinic uses 16 units of a disposable medical supply each operating day.
The supplier normally requires four operating days to deliver an order, and the clinic maintains 30 additional units as safety stock.
The reorder point is:
(16 × 4) + 30 = 94 units.
When the inventory position reaches the reorder point, the designated employee should review replenishment needs under the approved purchasing process.
For a complete inventory position, consider available stock alongside outstanding orders and committed demand.
This method supports medical supplies ordering, medical office maintenance planning, administrative workflow automation, and medical admin dashboard reporting.
Technology expenses: Evaluate total cost of ownership
Medical practices may pay for an EHR, scheduling system, secure fax service, patient portal, cybersecurity software, payment processing, and other administrative technologies.
The subscription price represents only part of the cost.
A complete evaluation may include implementation, integration, migration, training, support, usage-based fees, security requirements, and contract termination obligations.
Consider two hypothetical scheduling platforms.
Platform A: $700 monthly, plus an estimated $250 monthly in recurring integration and transaction fees.
Platform B: $850 monthly with the required integrations included under the assumed usage level.
The estimated annual direct service cost is:
Platform A: $950 × 12 = $11,400.
Platform B: $850 × 12 = $10,200.
Platform B appears $1,200 less expensive annually under these assumptions. The decision should also consider implementation expense, reliability, contract requirements, and staff time.
Financial planning for cloud-based EHR systems, secure healthcare messaging, healthcare cybersecurity, and medical administration troubleshooting should incorporate both contractual and operational costs.
Capital equipment: Understand depreciation and cash requirements
Suppose a practice purchases equipment for $48,000, with an estimated useful life of five years and zero residual value.
Under a simplified straight-line depreciation assumption:
$48,000 ÷ 60 months = $800 in monthly depreciation.
The actual cash requirement depends on whether the practice pays immediately, finances the purchase, or uses another arrangement.
Repayments, interest, depreciation, and initial purchasing cash flows should be classified appropriately.
Administrators should also budget for training, consumables, preventive maintenance, calibration, repairs, and potential service interruptions.
Equipment decisions can affect medical office maintenance, healthcare disaster planning, medical administration technology, and healthcare analytics reporting.
4. Cash Flow, Accounts Receivable, and Revenue Cycle Budgeting: Keeping Medical Practices Financially Stable
A practice can record substantial service revenue while experiencing a temporary shortage of available cash.
The timing of payer reimbursements, patient payments, payroll, debt obligations, and supplier invoices determines whether the organization can meet its commitments.
Medical administrators should recognize developing liquidity problems early and provide finance teams with reliable operational information.
Build a 13-week rolling cash-flow forecast
A 13-week forecast provides a short-term view of expected cash receipts and payments.
It is particularly useful when revenue collection timing is uncertain or when major expenses are approaching.
Each week should include:
Opening cash: Available cash at the beginning of the forecast period, applying the organization's definition of unrestricted operating cash.
Expected receipts: Insurance payments, patient collections, and other confirmed or reasonably estimated cash inflows.
Expected payments: Payroll, benefits, rent, vendor invoices, financing payments, taxes, and necessary purchases.
Closing cash: Opening cash plus receipts minus payments.
Suppose a practice starts Week 1 with $80,000 in available cash.
It expects $42,000 in receipts and $53,000 in payments.
Week 1 closing cash = $80,000 + $42,000 − $53,000 = $69,000.
If Week 2 begins with $69,000, expects $35,000 in receipts, and has $58,000 in required payments:
Week 2 closing cash = $69,000 + $35,000 − $58,000 = $46,000.
The forecast reveals a $34,000 reduction in available cash over two weeks.
Management should investigate collection timing, approaching obligations, and approved options for protecting required liquidity.
Tools supporting healthcare analytics, medical admin dashboards, healthcare data management, and workflow automation can help maintain the underlying information.
Days in accounts receivable: Measure collection delays
Days in A/R estimates how long outstanding revenue remains in the receivables process.
A simplified calculation is:
Days in A/R = ending accounts receivable ÷ average daily adjusted revenue.
Suppose a practice has $300,000 in net accounts receivable and average daily adjusted revenue of $10,000, calculated using a consistent reporting methodology.
$300,000 ÷ $10,000 = 30 days in A/R.
This example indicates receivables equal to approximately 30 days of the selected revenue measure.
The denominator must match the practice's reporting definition. Some industry reports use adjusted charges, while others apply revenue-based calculations.
Compare trends using the same method and examine differences across payers, service categories, and patient-responsibility balances.
Administrative delays originating in virtual patient check-in, medical documentation software, secure messaging, or medical software integrations may contribute to longer collection times.
A/R aging: Prioritize outstanding balances intelligently
A/R aging organizes outstanding amounts according to how long they have remained unpaid.
Common categories include 0–30 days, 31–60 days, 61–90 days, 91–120 days, and more than 120 days.
Older receivables deserve investigation, although their recovery prospects differ.
For example, a $12,000 claim awaiting a recoverable documentation correction may require a different response from a $200 balance that has already received several valid patient statements.
Administrators should classify outstanding balances by:
Payer or patient responsibility.
Age and collectible status.
Denial or documentation reason.
Appeal or filing deadlines.
Assigned follow-up responsibility.
Expected recovery value and next action.
A structured queue can reduce duplicated investigations across medical team communication, secure patient correspondence, healthcare workflow automation, and administrative technology troubleshooting.
Denial prevention and cost to collect
A claim denial can create additional labor expense even when a payment is eventually recovered.
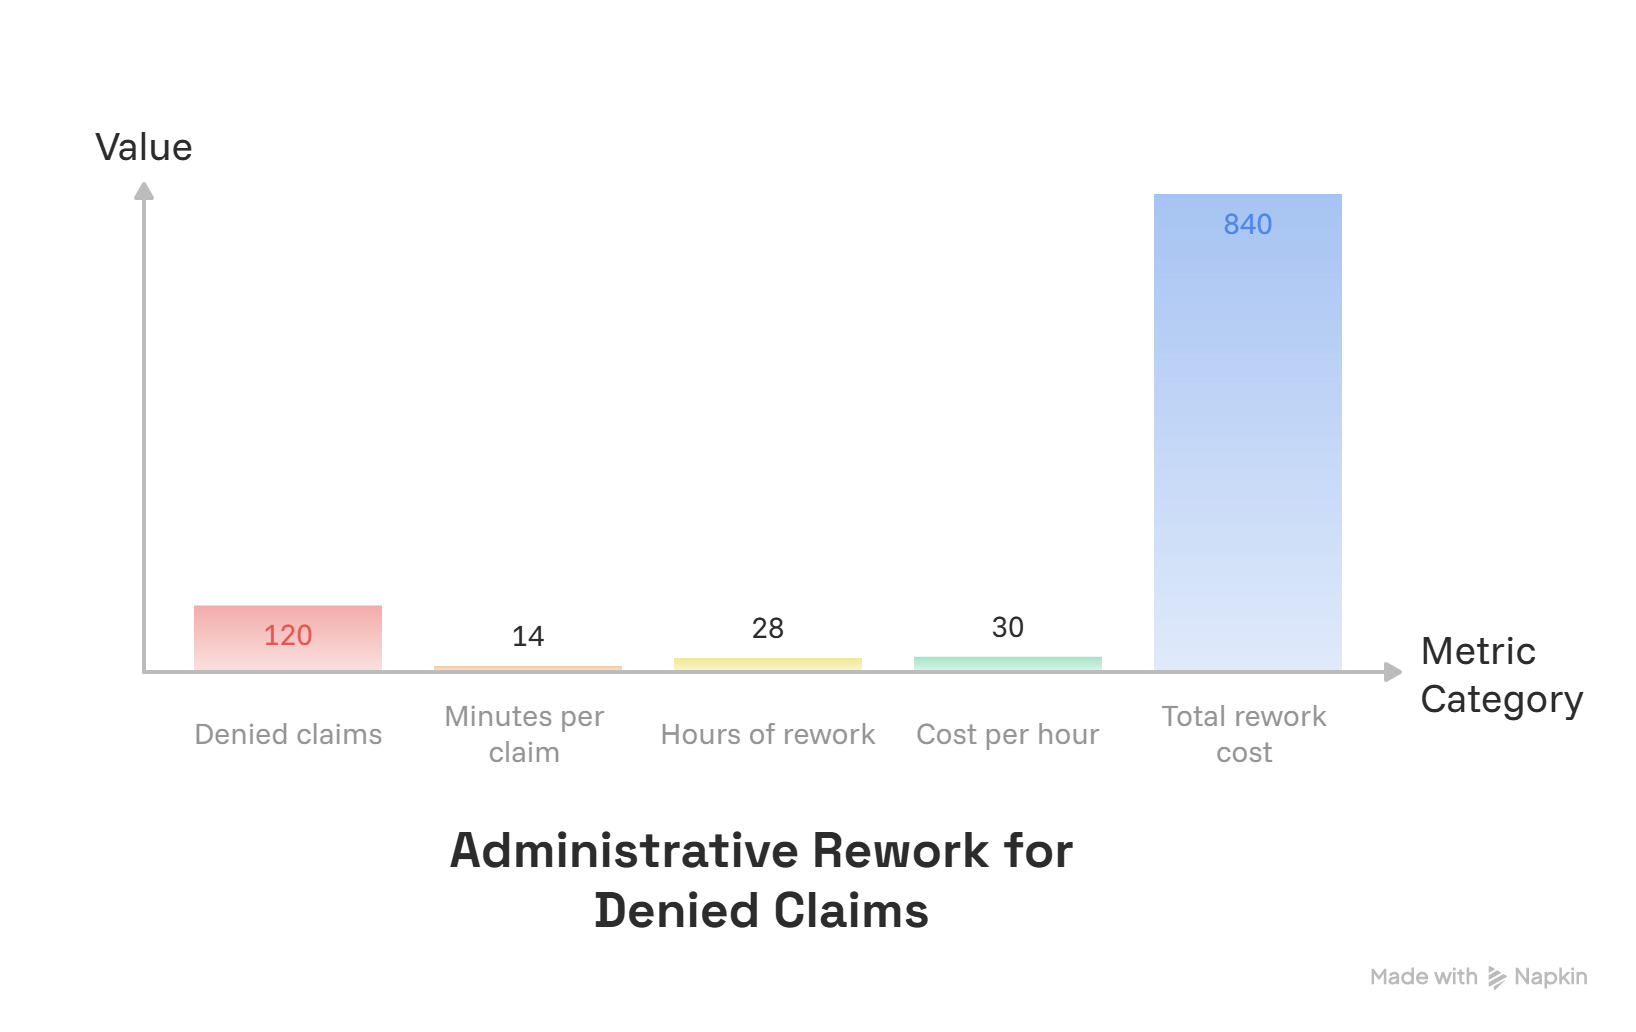
Suppose a practice receives 120 denied claims in one month. Each requires an average of 14 minutes of additional staff work.
120 × 14 minutes = 1,680 minutes, or 28 hours of rework.
At an illustrative loaded labor cost of $30 per hour:
28 × $30 = $840 in direct administrative rework.
This amount excludes delayed cash receipts and any ultimately unrecovered reimbursement.
Preventing recurring denials can therefore improve both revenue and operating costs.
A related metric, cost to collect, evaluates the expenses incurred to generate collections.
If defined revenue cycle operating expenses total $18,000 and related collections total $600,000:
Cost to collect = $18,000 ÷ $600,000 × 100 = 3%.
Different practices may include or exclude particular expenses. Consistent definitions are essential when comparing performance.
Improvements to patient registration procedures, medical documentation accuracy, data validation, and healthcare automation tools can reduce avoidable claim rework.
Cash reserves and scenario planning
A financial forecast should include a reasonable contingency for delayed collections and unexpected essential expenses.
Suppose a practice maintains $150,000 in unrestricted operating cash and experiences monthly net cash outflows of $50,000 under a defined stress scenario.
Its simplified runway is:
$150,000 ÷ $50,000 = 3 months.
This calculation assumes constant net outflows and excludes changes in receipts, financing access, restricted funds, and other commitments.
A more practical approach models multiple scenarios: expected collections, a moderate reimbursement delay, and a severe disruption.
Healthcare organizations can align financial contingencies with medical disaster planning, cloud-based EHR continuity, medical office maintenance, and healthcare compliance workflows.
A strong cash-flow process identifies potential shortages before they interfere with essential services.
5. Building a Medical Office Budget: A 30-Day Implementation Plan and Financial Performance Dashboard
Medical office budgeting becomes more effective when every major revenue and expense assumption has a responsible owner, supporting evidence, and a defined review schedule.
The following 30-day framework helps administrators establish a practical budgeting system using existing financial reports, scheduling information, payroll records, and purchasing data.
Days 1–7: Collect and validate historical financial information
Gather at least 12 months of financial and operational data when reliable records are available.
The initial review should include monthly collections, adjusted revenue, completed patient visits, payroll expenses, facility costs, medical supplies, technology spending, and outstanding receivables.
Use consistent reporting periods and resolve obvious discrepancies before calculating trends.
For example, one month's medical supply spending may include an unusually large purchase intended to cover several future months. That transaction requires appropriate classification before the practice treats it as ordinary recurring monthly consumption.
Separate recurring costs, one-time expenses, capital purchases, and unusual events.
Compare the financial records with medical supplies ordering, medical office maintenance logs, patient scheduling data, and healthcare analytics reports.
Expected deliverable: A validated historical financial baseline with recurring expenses, unusual transactions, and major budget drivers identified.
Days 8–14: Build revenue, staffing, and expense forecasts
Use completed visits and realistic payer assumptions to establish projected service revenue.
Then estimate staffing requirements based on expected workload, operating hours, and necessary clinical and administrative coverage.
Create separate expense categories for compensation, facility operations, supplies, technology, insurance, outside services, maintenance, and other material costs.
Assign an owner to each category.
Budget assumptions should be documented so employees understand why the forecast contains a particular amount.
For example, a projected increase in disposable supply expenses might reflect a planned service expansion, higher unit prices, or an anticipated increase in patient volume.
The underlying explanation determines whether future spending above budget indicates a problem.
Coordination across medical admin dashboards, workflow automation, medical software integration, and administrative team communication helps keep assumptions consistent.
Expected deliverable: A preliminary monthly operating budget with documented revenue drivers, expense assumptions, and accountable owners.
Days 15–21: Calculate break-even volume and test financial scenarios
Break-even analysis estimates the level of activity required to cover specified operating costs under defined assumptions.
A simplified model uses the contribution margin.
Contribution per visit = expected revenue per visit − variable cost per visit.
Break-even visits = total fixed costs ÷ contribution per visit.
Suppose a practice has:
Monthly fixed operating costs of $72,000.
Average expected revenue of $150 per completed visit.
Average variable cost of $30 per completed visit.
The contribution margin is:
$150 − $30 = $120 per visit.
The estimated break-even volume is:
$72,000 ÷ $120 = 600 completed visits monthly.
If the practice expects 700 visits, its simplified operating contribution after fixed costs is:
(700 × $120) − $72,000 = $12,000.
At 550 visits, the same model produces:
(550 × $120) − $72,000 = −$6,000.
This scenario illustrates the financial sensitivity of the practice to patient volume.
The simplified model assumes stable reimbursement, service mix, fixed costs, and average variable costs. Practices with multiple specialties or substantially different services should apply more detailed contribution analysis.
Administrators should review appointment scheduling capacity, patient no-show prevention, healthcare analytics reporting, and medical documentation processes when testing realistic visit and revenue assumptions.
Expected deliverable: A break-even estimate and at least three financial scenarios covering expected, lower-volume, and higher-cost operating conditions.
Days 22–30: Establish variance reporting and financial accountability
Once the budget is approved, compare actual results with expectations on a recurring schedule.
Budget variance identifies the difference between forecast and actual performance.
Suppose monthly medical supply expenses were budgeted at $14,000 but actual expenses reached $17,000.
The unfavorable expense variance is:
$17,000 − $14,000 = $3,000.
As a percentage of the original budget:
$3,000 ÷ $14,000 × 100 = 21.4%.
Management should investigate the reason for the excess spending.
Possible explanations include higher patient volume, supplier price increases, emergency purchasing, material waste, or an inaccurate initial estimate.
Each cause requires a different response.
If patient visits increased substantially, some expense growth may be justified. Compare actual usage against the revised activity level before assigning responsibility for overspending.
Reviewing medical supplies management, healthcare analytics, medical office maintenance, and workflow automation reports can reveal the original driver.
Expected deliverable: A recurring budget-versus-actual review with documented variances, responsible owners, corrective actions, and forecast updates.
Seven indicators to include in a medical office financial dashboard
A practical dashboard should track both financial results and the administrative processes influencing them.
1. Net collection rate: Shows how effectively the practice collects revenue considered collectible under its reporting definition.
2. Days in accounts receivable: Indicates collection timing and developing receivables delays.
3. Operating expense ratio: Evaluates specified operating costs relative to the selected revenue measure.
4. Loaded staffing cost per completed visit: Connects employee expense with actual service volume.
5. Supply cost per completed visit: Helps identify changes in purchasing efficiency, utilization, and service mix.
6. Operating margin: Measures operating income as a percentage of operating revenue.
7. Minimum projected cash balance: Identifies the lowest expected unrestricted cash position within the forecast period.
Every metric should have a documented formula, reporting frequency, source system, and accountable reviewer.
A dashboard can become misleading when revenue measures come from one accounting period while related cost measures come from another.
Reliable medical admin dashboard terminology, healthcare data management, medical software integrations, and healthcare analytics help maintain reporting consistency.
The most useful financial reports identify specific operational problems, explain their financial consequences, and support a measurable corrective decision.
6. FAQs: Medical Office Budgeting Terms, Financial Planning, and Cost Management
-
A medical office operating budget commonly includes staffing, facility expenses, medical supplies, technology, professional services, insurance, maintenance, and other recurring operating costs.
Revenue planning should include expected services, payer mix, reimbursement assumptions, and collection performance.
Capital expenditures and cash-flow requirements should also receive appropriate attention.
Administrators can improve accuracy by reconciling expense records with medical supplies ordering, cloud-based EMR subscriptions, and medical office maintenance costs.
-
Gross charges represent amounts billed before applicable adjustments.
Net patient service revenue generally reflects the amounts recognized after contractual and other relevant adjustments under the practice's accounting policies.
Actual cash collections may occur in different periods from the related services.
For example, a practice billing $200,000 in gross charges with $60,000 in applicable revenue adjustments has $140,000 remaining before considering any additional adjustments required by its accounting methodology.
Understanding this distinction improves medical admin financial reporting, healthcare analytics, and medical data management.
-
Appropriate overhead varies according to specialty, staffing model, practice size, provider compensation arrangements, geographic location, and service complexity.
Administrators should compare financial performance with genuinely comparable practices using consistent cost definitions.
An overhead ratio may exclude certain provider compensation expenses in one report while including them in another.
A useful review should examine expense categories individually and determine whether each supports necessary operations.
Analyzing medical front-desk efficiency, workflow automation, and healthcare technology costs helps identify specific improvement opportunities.
-
An operating budget estimates revenues and expenses for a defined period.
A cash-flow forecast identifies when money is expected to enter and leave the practice's accounts.
A practice can recognize revenue for completed services while waiting several weeks for reimbursement.
The operating budget helps evaluate financial performance, while the cash forecast supports decisions involving payroll, vendor obligations, and liquidity.
Both benefit from accurate medical admin dashboards, healthcare analytics systems, and financial data management procedures.
-
No-shows can reduce completed patient visits while many staffing and facility expenses remain unchanged.
The financial impact depends on available appointment capacity, whether the opening can be filled, service type, and expected reimbursement.
For example, ten unfilled appointments with an estimated contribution margin of $100 each represent a potential $1,000 reduction in monthly contribution under those assumptions.
Medical practices can investigate patterns using appointment reminder software, patient scheduling integrations, and appointment wait-time management.
-
Calculate staffing expense using base compensation plus applicable employer payroll costs, benefits, paid leave, and other relevant employment expenses.
Separate productive hours, paid hours, overtime, and contracted staffing arrangements.
Use FTE calculations consistently when comparing staffing across periods.
Administrators should also consider whether automation or better task allocation can reduce unnecessary work while maintaining appropriate patient services.
Evaluating medical front-desk workflows, team communication procedures, and healthcare automation tools can reveal labor inefficiencies.
